Project: The Wiley House
Size: 2685.59 ft²
Building Type: Single Family Residential
Climate Zone: ASHRAE Climate Zone 5
University of Oklahoma
ARCH 5832: Building Performance Analysis
BASELINE ENERGY MODEL
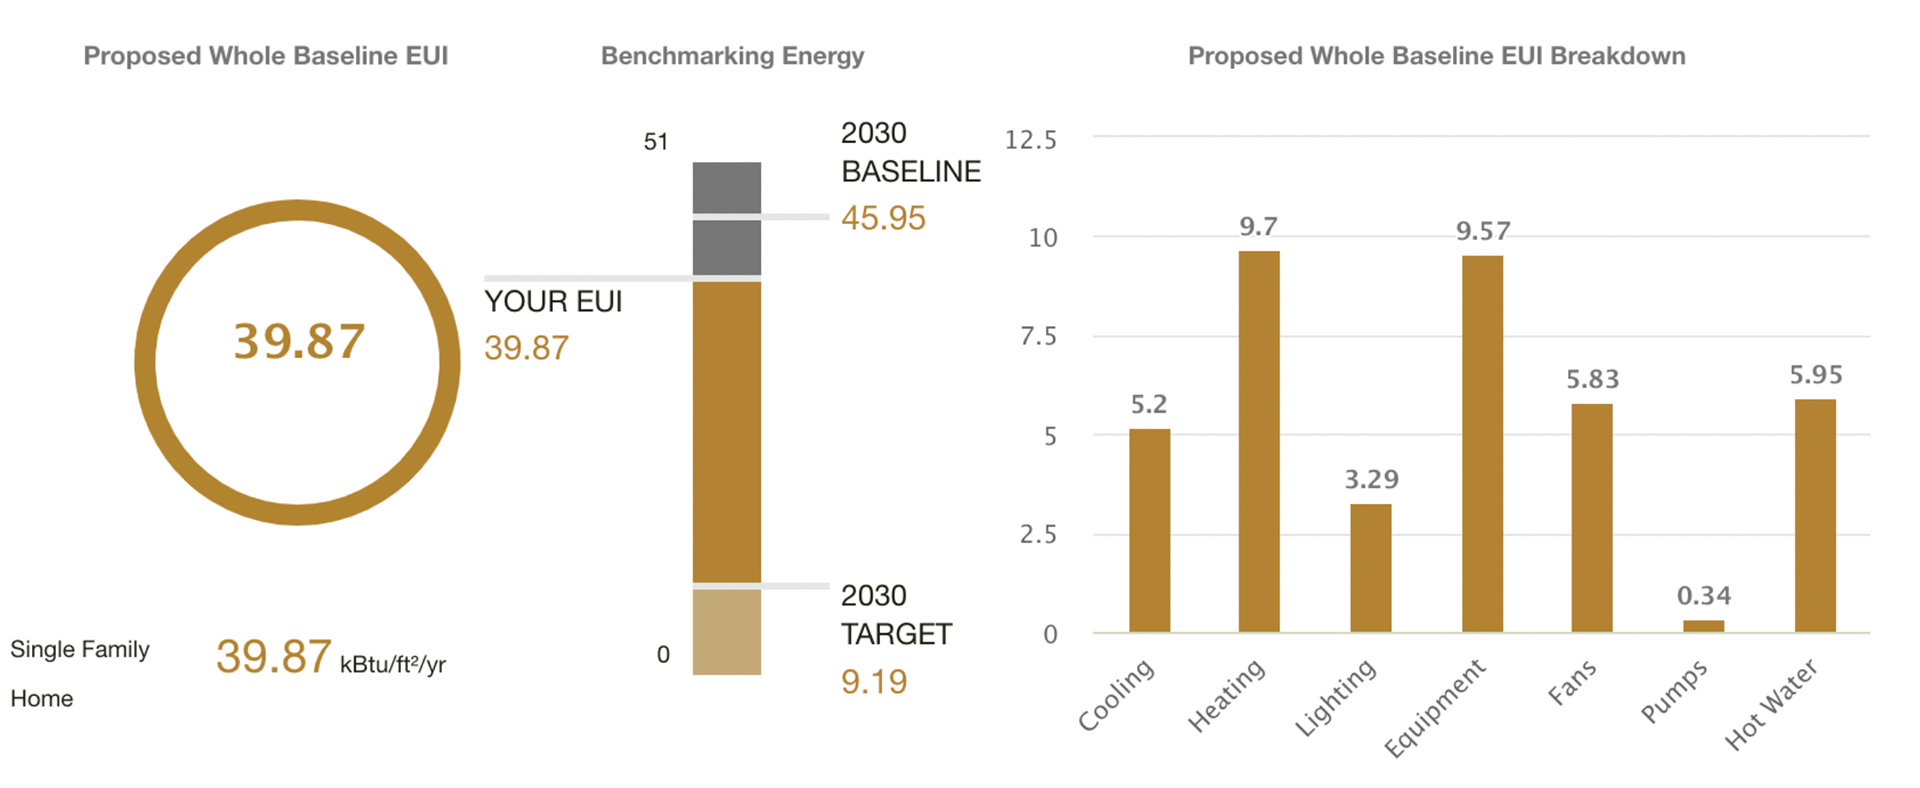
The Wiley House is a 2685.59 ft² single family home located in New Canaan, CT. The energy code used to evaluate this project is ASHRAE Residential 2018. This building is in ASHRAE Climate Zone 5. The analysis shows that the HDD (Heating Degree Days) are higher than CDD (Cooling Degree Days), making the heating load the dominate contributor to this project‘s energy use. The baseline model has an EUI of 39.87 with the heating making up 9.7 of that breakdown project‘s energy use. This project is under the 2030 baseline of 45.95, but far from the target of 9.19.
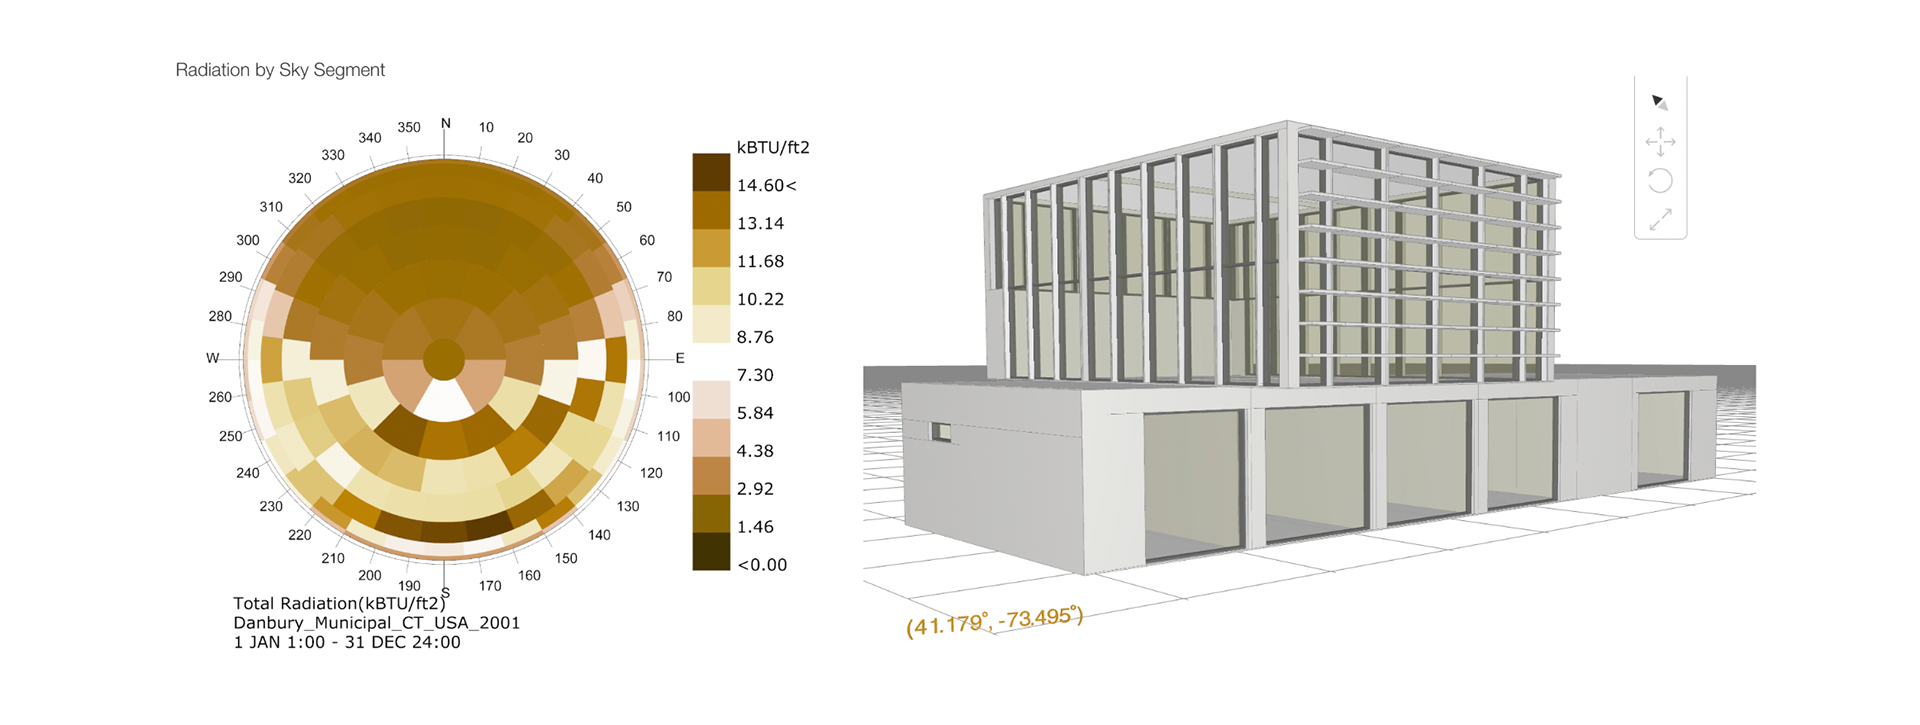
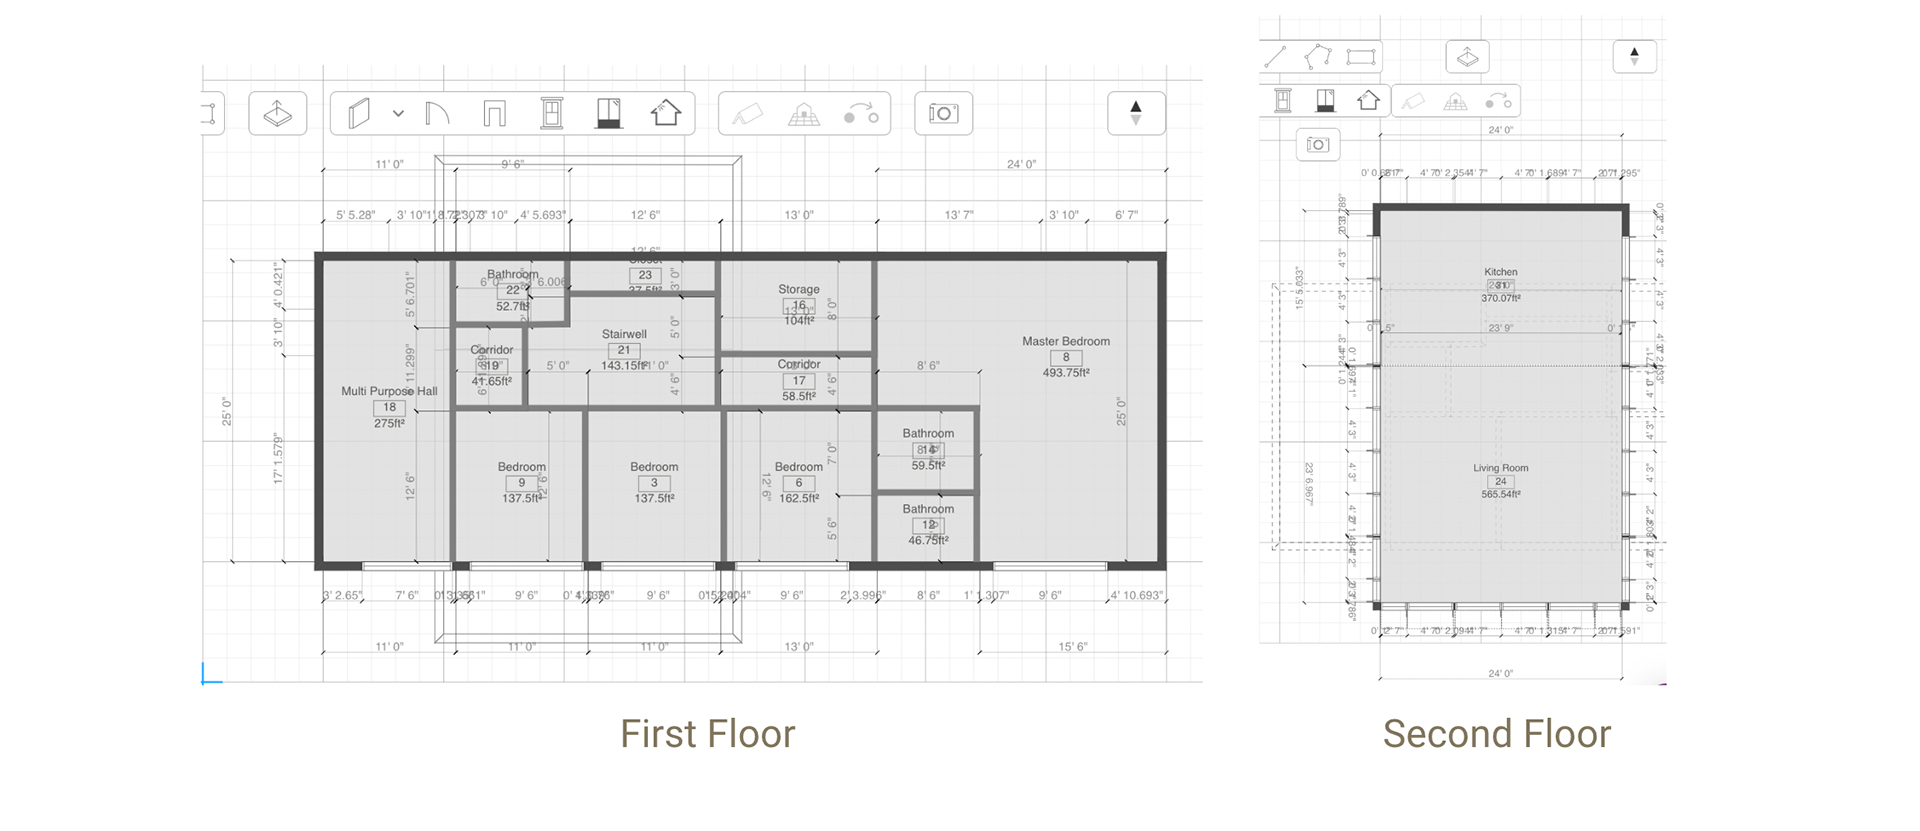
Our building’s axis has a NW/SE orientation. Looking at the Climate Analysis tab in cove.tool, we were able to see that the radiation intensity came entirely from the South, with very cool air coming in from the North. Note on the floor plan that the North side of the building does not have windows, allowing for more insulation in the exterior wall. This wind analysis provided additional proposed solutions to reduce the heat load.
CHANGES
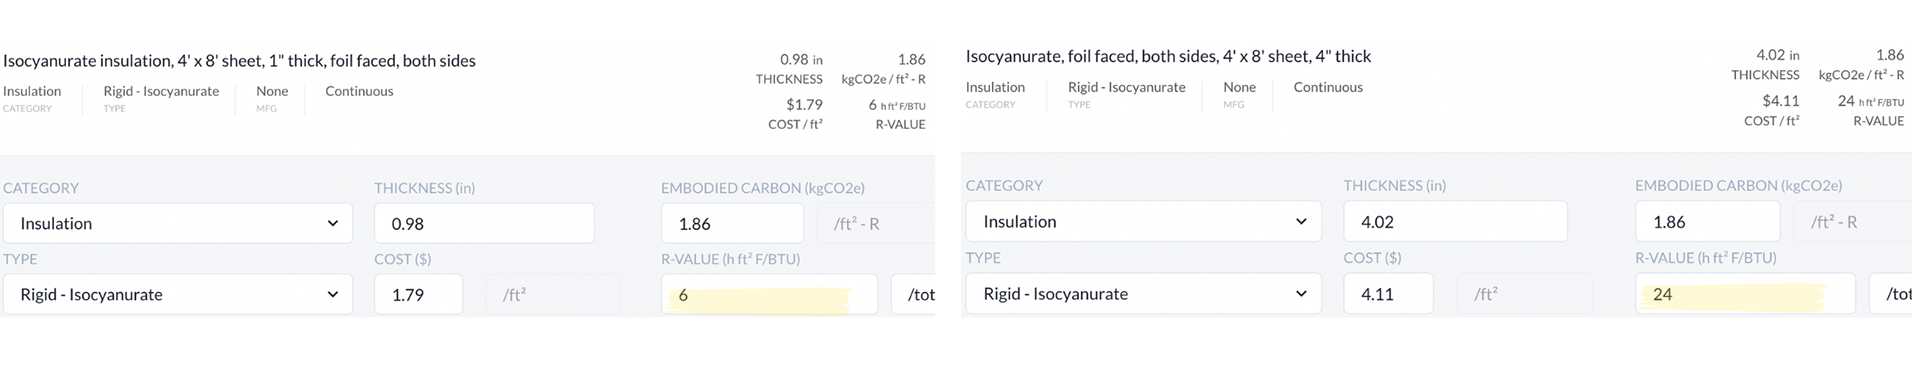
Wall & roof insulation
The first change we wanted to address was to increase the R-value of our exterior walls and roof. The original insulation thickness on the walls was 1-inch, we increased the thickness to 4-inches thus changing the R-values from the initial R-16.17 to R-24 for the exterior walls. The roof R-value was changed from the original R-33.91 to R-50.
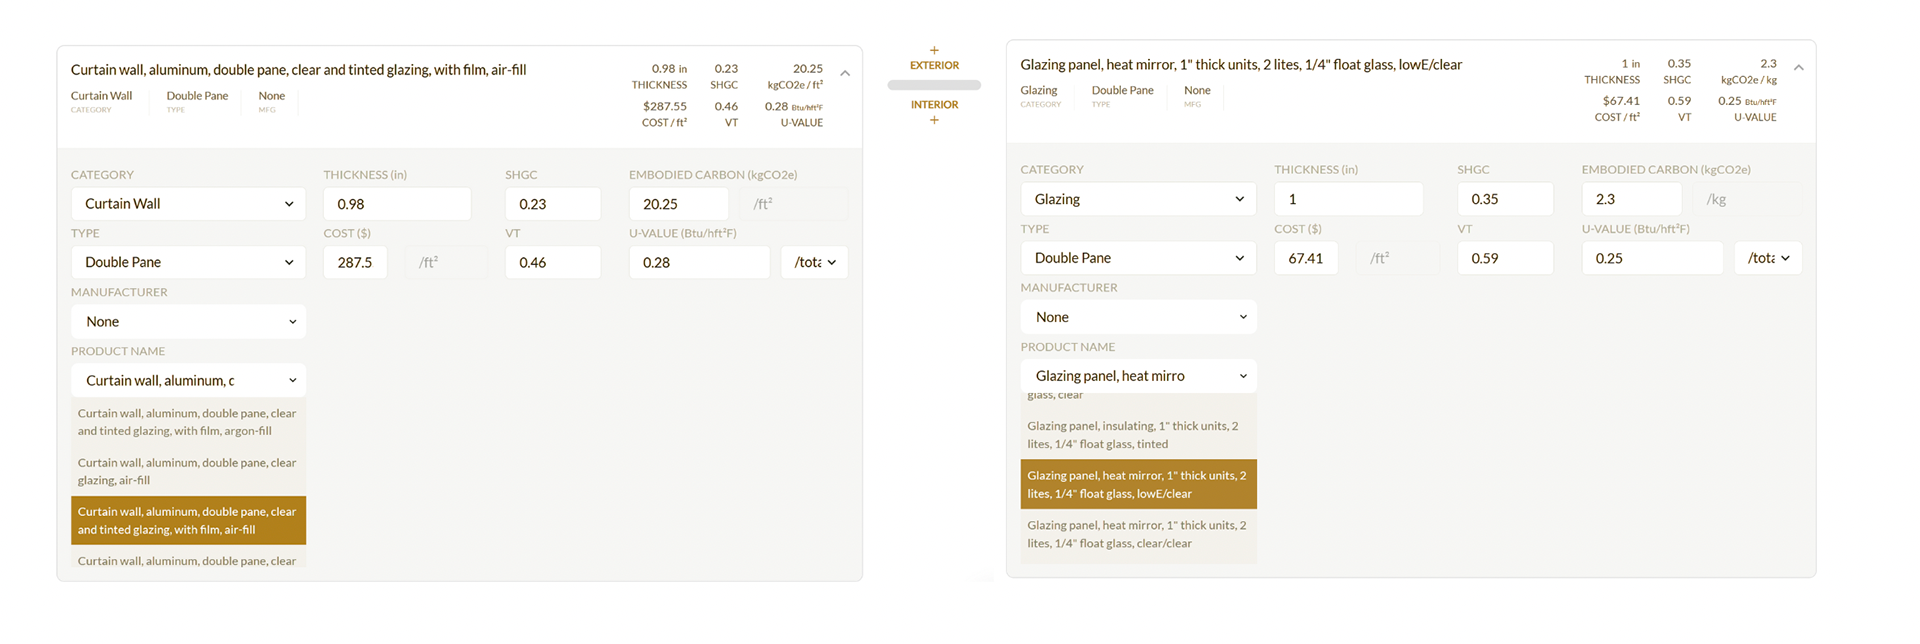
WINDOW GLAZING
The original design used double paned glazing in the curtain wall. The adjustments made change to a 1- inch insulated glazing unit, 2 1/4- inch lites with low-e coating and gas in between. This changed from the original u-value of 0.28 with an R-value of 3.57 to a u-value of 0.25 with an R-value of 4. This is a 10% change.
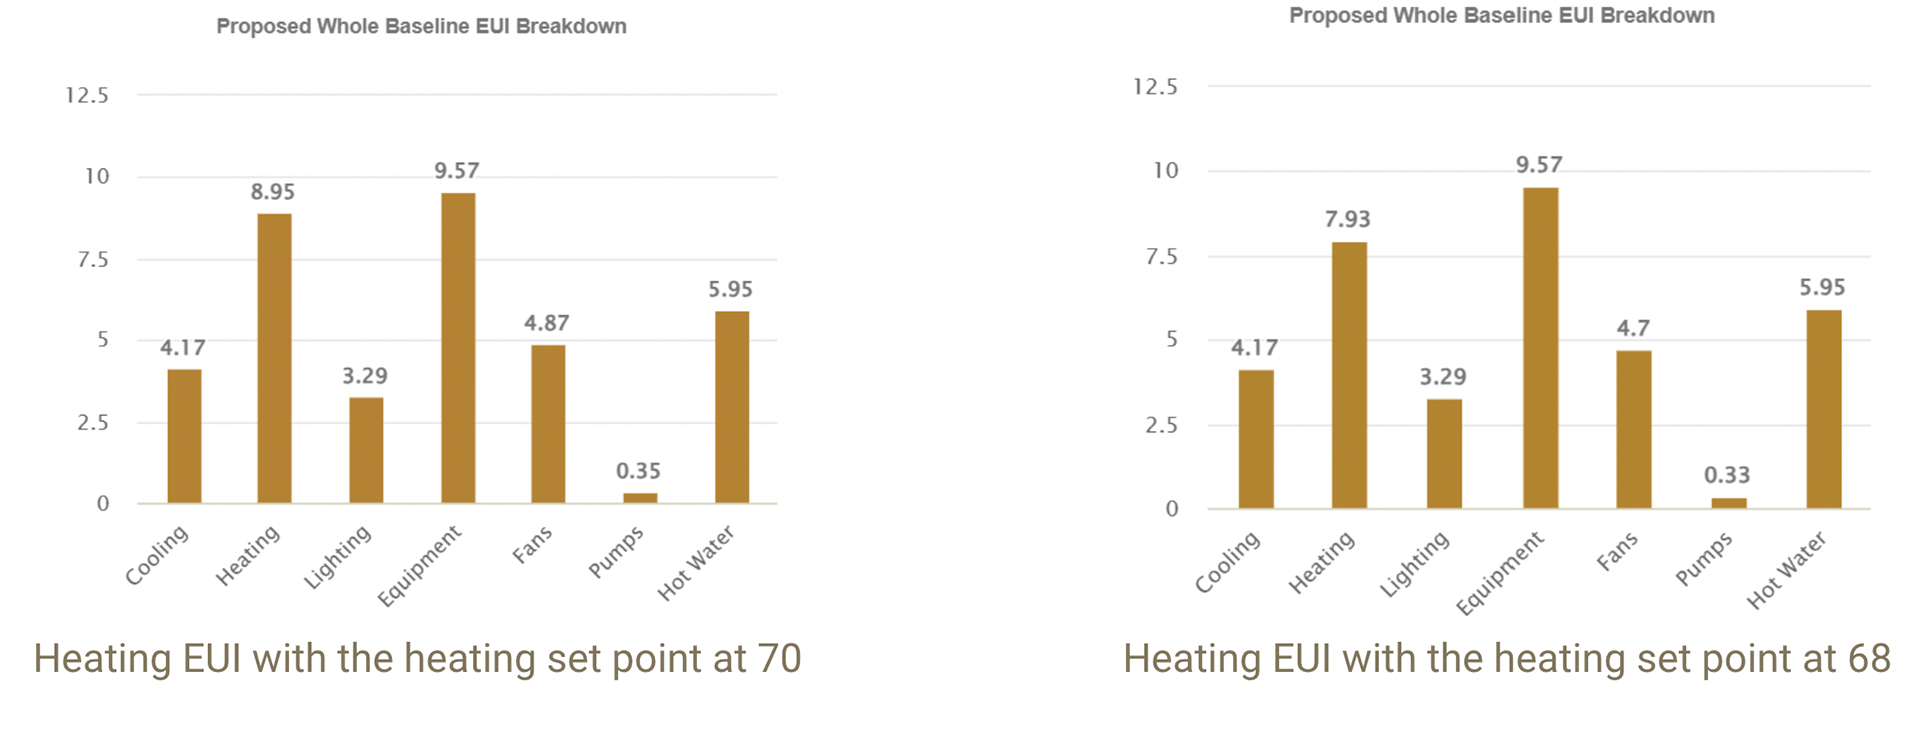
HEATING SET POINT
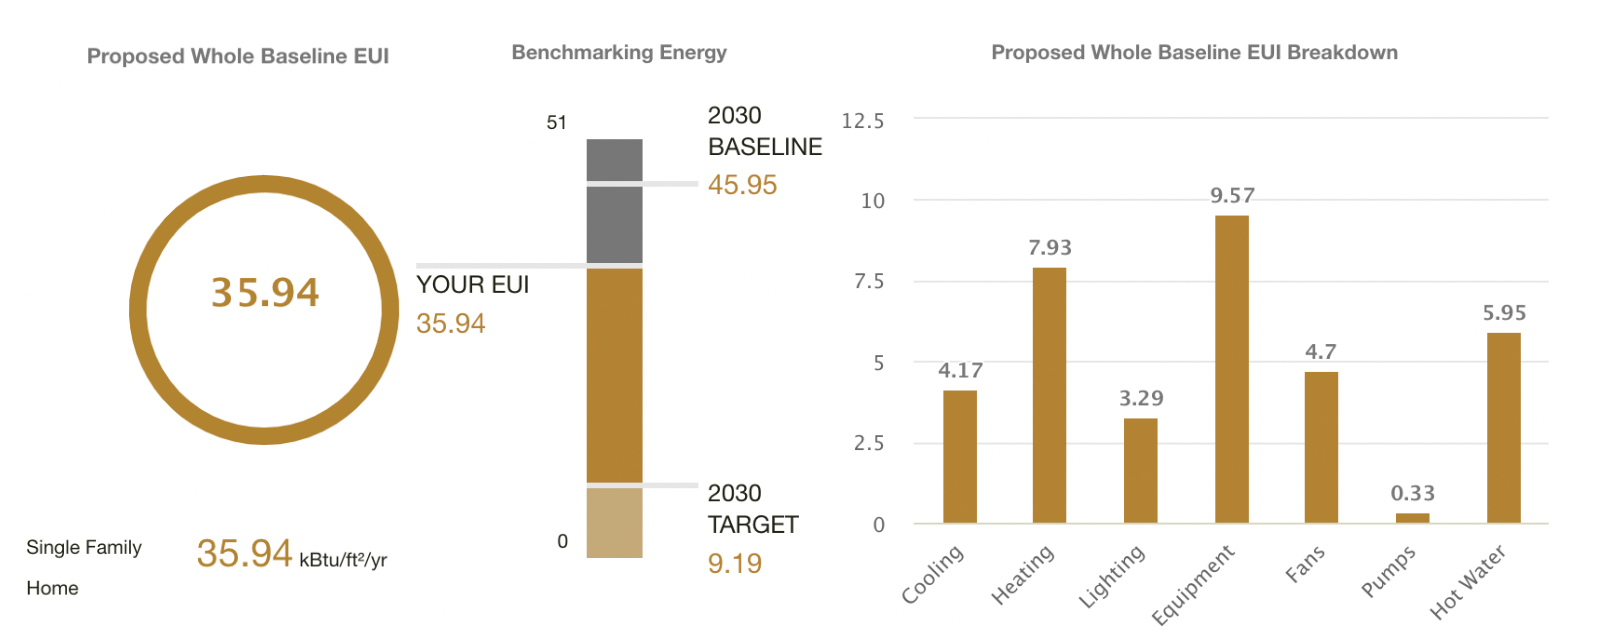
By changing the heating set point from 70 to 68, we were able to stay within the comfort zone according to the psychrometric chart found in the Climate Analysis tab. The Heating EUI changed from 8.95 to 7.93, an 11% change.
CONCLUSION
By changing the heating set point, window glazing, and the wall and roof R-value, we were able to drop our heating load impact by 18% and the overall EUI impact by 9.9% thus proving that the reduction in heating load impacts the overall EUI.